

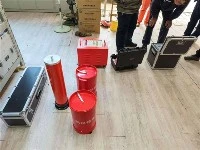

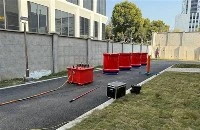
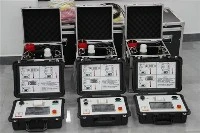
The oil dissolved gas tester under Wuhan UHV can help many power workers conduct various power tests more conveniently.
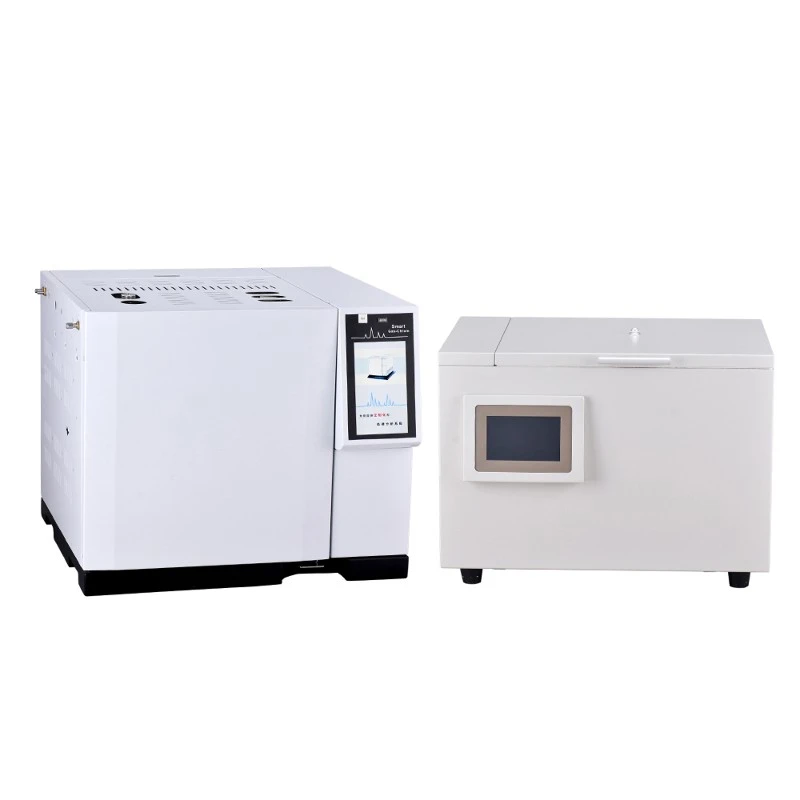
By analyzing the types, contents, production rates, and mutual ratios of dissolved gases in oil, the following diagnosis can be achieved:
1. Determine if the fault exists: During the normal aging process, insulation oil also produces a small amount of gas (mainly CO and CO ₂). But if characteristic gases such as hydrogen (H ₂), methane (CH ₄), ethane (C ₂ H ₆), ethylene (C ₂ H ₄), acetylene (C ₂ H ₂) appear and their content exceeds the standard or increases rapidly, it clearly indicates the presence of internal abnormalities.
2. Types of fault diagnosis: Different types of faults will produce different proportions of characteristic gases, which is the cornerstone of diagnosis.
Acetylene (C ₂ H ₂): is a signature gas of arc discharge. Its appearance usually indicates that the malfunction is quite serious.
Ethylene (C ₂ H ₄): is the main characteristic gas of high temperature overheating (usually>700 ° C).
Methane (CH ₄), ethane (C ₂ H ₆): related to overheating at lower temperatures.
Hydrogen gas (H ₂): usually associated with partial discharge or low-temperature overheating.
Carbon monoxide (CO), carbon dioxide (CO ₂): are products of overheating or decomposition of solid insulation materials (paper, wood blocks). Their content has significantly increased, indicating that the insulation paper has aged or been damaged, and the consequences may be very serious.
By using famous analysis methods such as the Duval Triangle and Rogers Ratio, the ratios of the key gases mentioned above can be encoded to accurately determine whether the fault is discharge or overheating, as well as the approximate temperature range of the fault.
3. Assess the severity of the malfunction:
Absolute gas production rate: the amount of gas produced per unit time. The faster the speed, the greater the energy of the fault and the more rapid its development, requiring immediate handling.
Relative gas production rate: the percentage increase in the content of a certain gas relative to its original value per unit time. Also used to determine the development trend of faults.
4. Monitor the development trend of faults: Regular (such as every 3 months, every six months) or online continuous monitoring can draw curves of various gas contents changing over time. Through trend analysis, it is possible to determine whether the fault is stable, weakening, or worsening, providing key basis for maintenance decisions.